

Track these seven stats and you will know exactly why you shoot the score you shoot: greens in regulation, fairways hit, putts per round, scrambling percentage, proximity from 100 yards, penalty strokes, and score by par type. If you only track one thing, make it greens in regulation. Grab a pencil and start this round.
TL;DR:
- Tracking greens in regulation and proximity from 100 yards provides the most significant insights for lowering scores, especially for improving approach accuracy.
- Focusing on one primary leak, such as GIR percentage or approach distance, and practicing it consistently for 30 days yields measurable handicap improvements.
- Conventional tools like scorecards are effective; advanced sensors offer little advantage unless paired with a clear, targeted practice plan.
- Variance in score consistency and hole-by-hole performance often reveals basic swing or decision-making flaws more than raw averages.
- Amateurs should compare their stats to specific handicap benchmarks and prioritize fixing the biggest gaps before moving on to secondary metrics like distance or bunker saves.
Table of Contents
- The Golf Stats to Track First, Ranked by Impact
- Scorecard, Apps, or Sensors: Which Golf Analytics Tool Fits You
- How to Read Your Numbers and Pick What to Fix First
- A 5-Step Starter Workflow You Can Use This Weekend
- Why Tracking Actually Moves Your Handicap
- Stroke Average and Scoring Consistency
- Strokes Gained Metrics Overview
- Driving Distance
- Sand Saves
- Key Statistical Benchmarks for Amateur Golfers
- What the Data Actually Tells Amateur Golfers to Do
- Sources
The Golf Stats to Track First, Ranked by Impact
Every golfer thinks they know their weakness. Most are wrong, because they are working off feel instead of numbers. Here is the priority order, backed by the six-stat approach that captures roughly 95% of what an amateur needs to know to find the leak in their game.
-
Greens in regulation (GIR). This is a hole where you reach the green in par minus two strokes, and it correlates with scoring better than almost any other single number. Mark a simple checkmark on your card for every green you hit in regulation. Tour pros hit somewhere north of 65% of greens; a 15 handicap typically sits closer to 25 to 30%, and a scratch amateur lands in the 55 to 60% range. If your GIR is low but your short game is strong, you are bleeding strokes off the tee or from mid-range approaches, not around the green.
-
Fairways hit (driving accuracy). Log a simple L, F, or R for left miss, fairway, or right miss on every tee shot with a driver or 3 wood. The number itself matters less than the pattern. A golfer who misses 70% of fairways right is fighting a different swing flaw than one who sprays it both ways, and that pattern should drive your next range session, not just the raw percentage.
-
Putts per round and putts-per-GIR. Total putts per round is the number everyone tracks, but it lies to you. A round of 32 putts sounds great until you realize half of them were tap-ins after great wedge shots. Putts-per-GIR (putts taken only on holes where you hit the green) isolates true putting skill from approach-shot quality. Pro Tip: Write your first-putt distance in feet next to your putt count on greens you hit in regulation. That single habit tells you whether you are missing greens in the fat part or leaving 40-footers that were never going in anyway. Golf as a top-tier stat for exactly this reason.
-
Scrambling, or up-and-down percentage. This is the percentage of missed greens where you still make par or better. Record a simple Y or N next to any hole where you missed the green. Amateurs in the mid-teens handicap range typically scramble around 15 to 25%, while tour pros save par 55 to 60% of the time. A low scrambling number paired with a low GIR means your whole ball-striking game needs work, not just your chipping.
-
Proximity to the hole by yardage band, especially the 100-yard shot. Break your approach shots into rough bands, inside 50 yards, 50 to 100, 100 to 150, and beyond 150, and jot down roughly how close you finished. The 100-yard shot deserves special attention because it is one of the highest-leverage stats an amateur can track: you will hit that yardage more often per round than almost any other, and small gains there compound fast.
Quick benchmark: A 5-yard improvement in average proximity from 100 yards saves roughly 0.4 strokes per round, which is enough to move a golfer from a 15 to a 14 handicap over a season of focused wedge work.
-
Penalty strokes per round. Count every stroke and distance penalty, whether it is a ball in the water, out of bounds, or an unplayable lie. This is the stat most amateurs undercount because each one feels like a fluke. Three penalty strokes across four different holes is not bad luck; it is a course-management pattern, and it is often the cheapest fix on this whole list.
-
Score by par type (par 3, par 4, par 5 breakdown). Average your score relative to par separately for par 3s, par 4s, and par 5s over five or six rounds. If your par 5 average is +1.8 while your par 3 average is +0.6, you are leaving easy birdie holes on the table, and that usually points to either driving distance or decision-making on your second shot into reachable greens.
Scorecard, Apps, or Sensors: Which Golf Analytics Tool Fits You
You do not need a launch monitor to start tracking golf performance metrics. The right method depends on how much time you want to spend and how much detail you actually need.
- Scorecard method: Add five extra columns to your existing card: FIR, GIR, Putts, Penalty, and Up-and-Down (Y/N). Each notation takes about 10 seconds per hole, and a full tally after the round takes maybe five minutes. This costs nothing and works for anyone.
- Phone apps: Apps like Accel Golf let you tap proximity bands and putt counts without pulling up a full GPS screen, and some are already used inside collegiate and junior development programs. Expect 15 to 20 seconds per shot if you log everything, or a fast post-round scan if you just fill in memory.
- Sensor systems: Platforms like Arccos or Shot Scope clip onto your clubs and log shot location, club distance, and strokes gained automatically. Expect to pay for the hardware and spend a few minutes editing rounds afterward. They earn their keep once you are playing more than two rounds a week and want strokes-gained detail without manual entry.
Pro Tip: If you are playing with a group, ask one partner to call out your fairway and green results as you walk off each hole. Logging in real time during a lull beats trying to reconstruct 18 holes from memory at the 19th.
How to Read Your Numbers and Pick What to Fix First
Raw stats mean nothing without a benchmark. Compare your numbers against your handicap range, then estimate which gap costs you the most strokes per round before you touch a practice ball.
- Low GIR with poor 100-yard proximity points to approach and wedge practice, not the putting green.
- Decent GIR but high putts-per-GIR means your ball-striking is fine and your speed control on the greens is the leak.
- High penalty-stroke variance signals a course-management problem, often an aggressive line off the tee that only pays off some of the time.
This is essentially a stripped-down version of strokes gained, the analytics framework built by Columbia professor Mark Broadie that breaks scoring into off-the-tee, approach, around-the-green, and putting categories. You do not need sensor hardware to borrow the thinking: pick the category bleeding the most strokes and attack it for 30 days.
Rule of thumb: Five rounds is usually enough data to trust a pattern. Fewer than that and one bad hole can skew the whole picture.
A 5-Step Starter Workflow You Can Use This Weekend
- Build your card. Add columns for FIR, GIR, Putts, Penalty, Up-and-Down, and a 100-yard proximity bracket.
- Mark it fast. One letter or number per hole, nothing more, so pace of play never suffers.
- Tally in two minutes. Circle whichever stat sits furthest below your handicap benchmark.
- Practice that one leak for 30 days, ignoring everything else on the range.
- Reassess after five rounds and expect a realistic target, like cutting three-putts by half or gaining half a stroke in scrambling.
Why Tracking Actually Moves Your Handicap
The evidence backs this up: platforms built around strokes-gained-style analytics report average handicap improvements within the first year for golfers who track consistently, compared to those who guess at their weaknesses.
The golfers who improve fastest are not the ones swinging the most range balls. They are the ones who know, in numbers, exactly which shot type is costing them strokes before they ever pick up a club.
Worldamateurgolftour builds that same numbers-first mindset into every WAGR-counting event, with live scoring and player development resources that turn a single round into usable data. Once your practice starts producing results, structured competition is where that improvement gets tested and ranked.
Stroke Average and Scoring Consistency
Your stroke average tells you where you stand; your standard deviation tells you whether you can trust that number on any given day. Two golfers can both average 88, but one shoots between 85 and 91 every time out while the other bounces from 79 to 97. The second golfer has more raw talent and a much bigger leak somewhere in their game.
Track your last ten rounds and calculate the spread, not just the average. A tight range usually means your fundamentals, grip, setup, tempo, are solid and your practice time should go toward specific skills like proximity or scrambling. A wide range usually points to something more basic: a swing thought that comes and goes, or a mental game that unravels after one bad hole.
Consistency also shows up hole by hole. If you chart your score relative to par on every hole across several rounds, most amateurs find a cluster of two or three holes on their home course that account for a disproportionate share of their bad numbers. That is not the course being unfair. That is a specific shot, often a certain club or a certain type of approach, that needs deliberate attention rather than general "play more golf" advice.

Score-by-par-type data, covered earlier, feeds directly into this. A golfer whose par 4 scoring is consistent but whose par 5 scoring swings wildly usually has a second-shot decision problem on reachable holes, going for greens they should be laying up short of, or vice versa.
Strokes Gained Metrics Overview
Strokes gained compares every shot you hit against a scratch-golfer baseline for that exact distance and lie, then tells you whether that shot gained or lost strokes relative to expectation. Mark Broadie developed the framework using PGA Tour ShotLink data, and it now breaks into four buckets: strokes gained off the tee, approach, around the green, and putting.
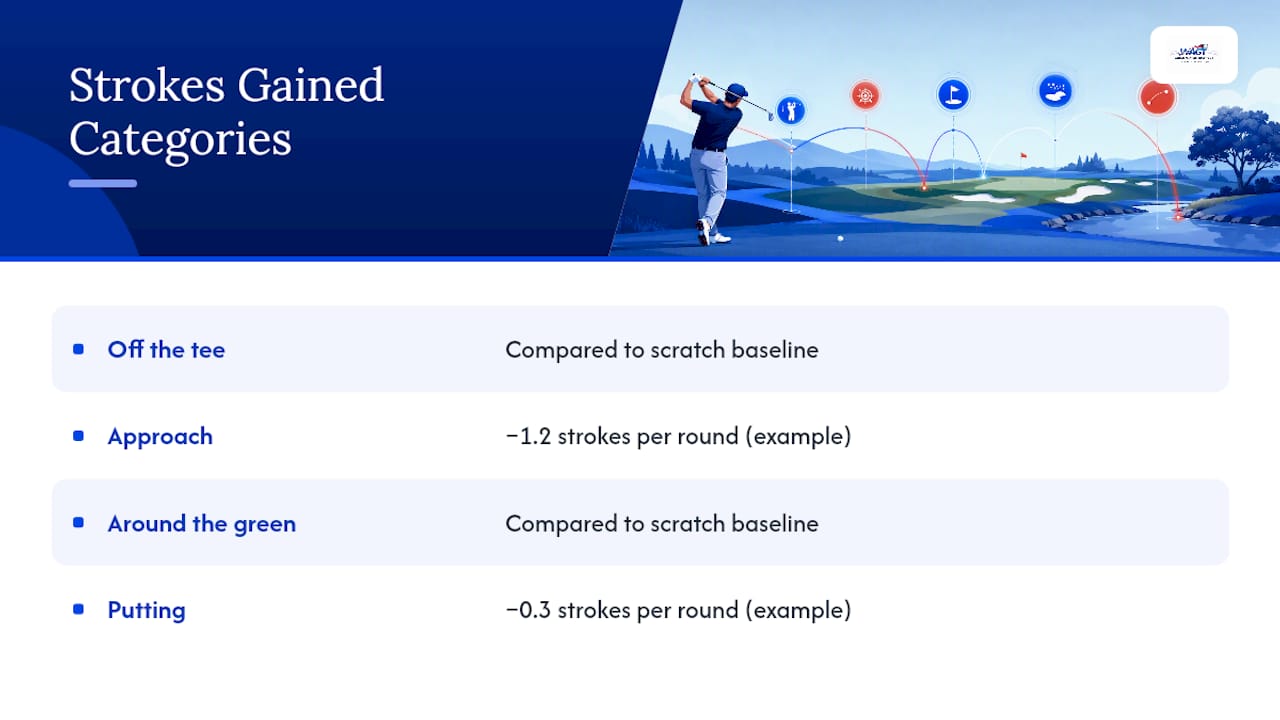
You do not need a sensor system to think in these terms. If your proximity from 100 yards is consistently 10 yards worse than a scratch player's expected result, you are losing strokes gained approach on every one of those shots, whether or not software labels it that way.
The real value of strokes gained is comparison across categories using the same unit, strokes. It lets you say "I am losing 1.2 strokes per round on approach shots and only 0.3 on putting," instead of comparing unrelated numbers like fairway percentage against putts per round. That is why Broadie's own advice steers golfers away from vanity metrics like distance toward stats that map directly to strokes lost or gained on the scorecard. If you are logging the six core stats from earlier in this piece by hand, you are already collecting the raw material strokes gained is built from. A sensor platform just automates the math and adds precision you can layer in later.
Driving Distance
Driving distance gets more attention than almost any other golf stat, and it deserves less credit than it gets. Distance matters, but it is not the leverage point for most amateurs the way GIR, proximity, or putting are.
Here is why: adding 15 yards off the tee might turn a 175-yard approach into a 160-yard approach. That is a real gain, but it is a modest one compared to fixing a wedge game that is missing greens from 100 yards by 30 feet instead of 15. Distance also carries a hidden cost. Amateurs chasing extra yards frequently sacrifice fairway accuracy, and a longer drive in the trees is worse than a shorter one in the fairway.
Track your driving distance if you want to, average it over a season using a rangefinder or GPS app, but treat it as a secondary stat. It is useful context for club selection and for understanding your own game, not a primary lever for lowering scores. The exception is golfers who are dramatically short, well under 220 yards off the tee, since added distance there can shift entire par 4s from three-shot holes into two-shot holes and change your par 5 scoring average significantly.
Sand Saves
A sand save is a par or better after your ball lands in a bunker, and it is a narrower cousin of overall scrambling percentage. Track it separately if you find yourself in greenside sand often enough that it is a recurring pattern rather than an occasional accident.
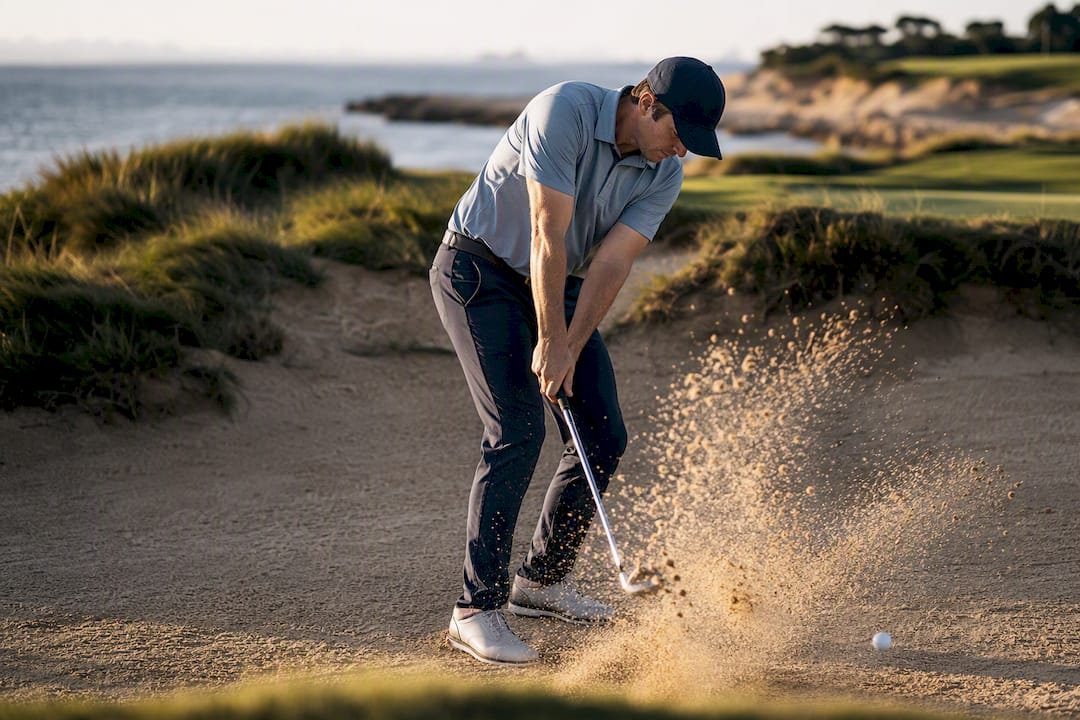
Tour pros save par from the sand around 50% of the time.
If your sand save rate is a clear weak point relative to your overall scrambling number, that is a specific, fixable signal. Twenty minutes of dedicated bunker practice, focusing on consistent entry point and speed rather than trying to spin every shot close, moves this number faster than almost any other stat on this list. If sand saves are not a frequent situation for your course or your typical miss pattern, do not bother tracking it separately; it will just add noise to your card for a shot you rarely face.
Key Statistical Benchmarks for Amateur Golfers
Numbers only mean something in context. Here is how the core stats break down across handicap ranges, so you know what "good" actually looks like for your level before you start comparing yourself to tour pros.
Use this table as a starting benchmark, not a scoreboard. The point is not to feel bad about a 20% GIR rate at a 22 handicap; that is roughly where the range says you should be. The point is to spot the one stat where you sit noticeably below your own bracket, because that gap is your highest-leverage practice target for the next month. For a broader look at how these numbers connect to competitive play, comparing tournament factors that value short-game recovery rates can sharpen your sense of where scrambling and GIR fit into the bigger picture.
What the Data Actually Tells Amateur Golfers to Do
Most instruction content tells amateurs to track everything, and that advice is backwards. The golfers who actually improve are the ones who pick one number and leave the rest alone for a month. Trying to fix your putting, your driving accuracy, and your bunker play in the same three weeks is how golfers end up with no real data and no real progress, just a scorecard full of half-finished notes.
The conventional wisdom oversells sensor technology, too. A $300 sensor system will not find your leak any faster than a pencil will, because the bottleneck was never data collection. It was always the decision about what to do with the data once you have it. A golfer with five rounds of honest scorecard notes and a clear priority beats a golfer with a season of sensor data and no plan.
If there is one thing worth borrowing from how development programs evaluate athlete performance data more broadly, it is this: raw numbers only become useful once you rank them by leverage and commit to acting on the top one before moving to the next. Start with proximity from 100 yards or your GIR rate. Those two carry more weight than anything else on this list, and they are the two stats a scorecard captures just as well as a $400 launch monitor.
— Gene
Sources
- Datadriven
- Golf
- What golf stats should amateurs track? The six that actually lower scores — T5 Golf
- Golf stat tracking and amateur adoption — Golf Digest